WhatsInside.Earth
Rate Graph page improved 12 Aug
Welcome to pondering..
What’s Inside Earth?
In huge contrast to hordes of spacecraft exploring throughout the Solar System for decades,
humanity lacks any direct perceptions or observations of the vast majority, nearly the entirety of Earth’s interior, greater than 99% of it:

..due to extreme heat much nearer the surface than geologists can explain: It dulls drill bits,
plus hot, softened strata are too flexible to maintain a stable well bore long enough, hence:
The greatest depth ever drilled is 7.6 miles (vertically) – 30 years ago.. Not exceeded since.
¹ 7.6 of 3959 miles radius = 0.6% of total volume → calculation here
But geology peered much deeper via a paradigm-disrupting discovery:
Earthquakes trigger additional quakes thousands of miles away:
An exhaustive examination of Earth’s quaking during half a century revealed:
Strong earthquakes are “most likely* to induce another quake
[near] the point directly opposite it* on the other side of the globe.”
* emphasis added
This comprehensive analysis of many thousands of earthquakes revealed additional quakes are triggered far beyond where aftershocks have long been known to occur.
But even more disrupting than triggering on the opposite side of Earth:
Triggering also occurs on the same side: one fourth as far as Earth’s opposite point
at 45º – more than 3,000 miles distant – plus also farther at 75º distant.*
Absence of triggering at 90º* ‐ halfway to the opposite point ‐ completes these revelations, the most compelling of much evidence supporting uncommon ideas about Earth’s interior..
culminating years of accumulating evidence also included herein, how earthquakes rocket waves of shock energy all around Earth that crash back together near the opposite point on Earth from the earthquake that triggered them.
* ( º ) = degrees distant, explained here.
To anyone sufficiently familiar with science, it’s no surprise the four authors* just reported their masterful analysis and calculations, solely:
* Oregon State University (OSU) faculty ²
They completely avoided offering even one phrase attempting to explain the results, nor made the slightest mention how their findings might be applied or further employed, neither practically nor theoretically.
² who well deserve a new sort of
Nobel Prize created for them
In their press release,* the lead author even acknowledged:
“understanding..how one earthquake could [trigger] another while being
widely separated in distance..is still largely speculative.”
*also linked above
These landmark results are actually strong if not conclusive evidence demonstrating:
When a major earthquake strikes it, the whole Earth trembles,
at least somewhat analogous to a ringing bell !
As a geologist put it following a massive earthquake in 2012: “The whole Earth was vibrating like a bell..” and “Seismic waves* circled the Earth multiple times.”
Encyclopedia Britannica agrees the most powerful earthquakes “cause the whole Earth to ring like a bell.”
* Geologists’ term for what most folks call shocks or shockwaves:
seismos = earthquake in Greek
The exhaustive details published online by Nature* thoroughly and entirely support a bell analogy, as demonstrated herein.
* World’s most prominent science publisher: The report is highly technical. Graciously provided without charge.
This web site can just begin touching the vast, mind-boggling ramifications for understanding not just humanity’s home planet.. → The entire universe.. existence in general...
Please note the word analogy: In great contrast with a bell cast from uniform material to ring true, Earth has a virtually endless variety of rocks and strata, seems more a chaotic jumble:
Hence, these landmark results are mainly indicating new directions for contemplating and wondering what things are like inside our celestial orb home.
A paradigm’s reign has ended, but a new regime awaits discovery, uncovering, imagining…
After examining the evidence, some ramifications are noted, not just for geology.
Key Points Herein
A solid rock sphere never rings like a bell when struck:
This discovery sheds much light on earthquake phenomena in general,
clearly revealing what seems unthinkable:
Earth demonstrates resonance, somehow analogous to a bell.
Especially for Geologists:
Earthquakes also triggered at 45º and 75º from epicenters indicate
narrow constraints on the thickness of strata seismic waves resonate in.
Also consistent is where seismic waves are detectable around the Earth,
and especially where not: the so-called Shadow Zone, discussed below.
Note: This site is addressed to a general audience especially because this discovery
has such momentous implications for comprehending all existence.
❧ Just because it seems unthinkable Earth could have properties resembling a bell
does not eliminate the possibility.
❧ This site makes no attempt to explore how Earth might have come to be this way, nor what things are like deep inside . . just examines how everything known about our home planet is consistent with an outer shell that somehow confines seismic wave energy.
❧ Furthermore, some sort of shell-like configuration seems at least somewhat similar to geologists’ current theories about planet-sized conveyer belts ever gradually shifting
oceanic crusts thousands of miles to oblivion beneath continental crusts surrounding them.
❧ In fact, the shell analogy provides considerable support for somewhat similar ideas. ☙
But such arguments are best pursued after soberly facing what Oregon State,
Nature, plus Nature Herself are revealing.
Appreciating these landmark results requires basic familiarity with earthquake phenomena, succinctly provided by two diagrams.. after a couple of relevant perspectives about our astoundingly dynamic home planet:
X
Sections
click to jump there
TOP of page (“Welcome . .”)
Key Points
Earthquake Basics
90º Maximal Attenuation
Antipodal Focusing
Focusing in Asia
Rates of Triggering Graph
Not Like a Bowling Ball
Rethinking Seismology
The 45º + 75º Disrupters
Reflections on Seismic Waves
A Planetary Jackhammer
Reframing Seismology; Conclusions
About This Site; Gratitudes
TOP of page (“Welcome . .”)
close
A historically young and still somewhat puzzling idea commonly referred to as gravity is credited with keeping ones body grounded on the surface of a planet ever moving in complex ways at up to vastly mind-boggling speeds:
At the equator, where the speed is greatest, the rotation of Earth every 24 hours is constantly transporting one eastward at over 1,000 miles per hour, a supersonic* speed only the toughest of military jets can withstand:
* faster than the speed of sound
Without whatever gravity is, centrifugal forces would eject skyward anyone lacking a tether to Earth’s surface.
Plus the planet itself is ever hurtling through the Solar System unimaginably faster!*
( – Not to mention theories the System itself is hurtling yet vastly faster in the Milky Way,
which is itself hurtling further multiple times faster! ..and so on!)
These perspectives help explain how what ordinarily seems terra firma proves itself quite otherwise, at times horrifically:
Earth quakes significantly enough somewhere for seismometers* to detect at least several hundred up to a few thousand times daily (depending which authority one queries).
* instruments that detect earthquakes; link is Wikipedia’s page about
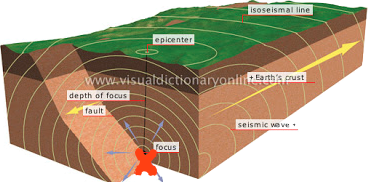
The below graphic illustrates powerful red waves humans experience as disturbing jolts rocketing forth in every direction as gargantuan sections of Earth along opposite sides of a fault suddenly and abruptly shift, rub, and crash against each other, as the two sides massively lurch and jerk in opposite directions¹ – at up to supersonic speeds! ² The worst earthquakes last many seconds, firing lots of violent jolts before the two sides finally slam back together in a new, tightly locked embrace.
¹at least relatively: In some cases, one side
of a fault shifts much more than the other.
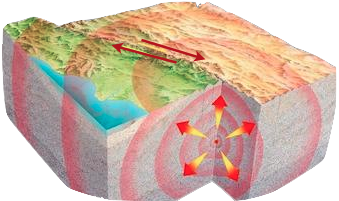
Each massive collision jolts surrounding rocks and strata as it fires a burst of colossal energy racing outward in every direction, a rapidly-expanding sphere of disruption geologists call a seismic wave,* analogous to circular ripples on a pond when something falls into it – But those are two-dimensional, on the surface..
* a basic overview
Again: seismic waves are spherical, three-dimensional:
Each of the six concentric spheres represented by complex red curves in the above illustration is a single seismic wave slamming outward and away in every direction from its origin many miles underground: the tiny red dot with arrows radiating from it, what geologists call the earthquake’s focus.
A single earthquake can produce hundreds of seismic waves, up to several dozen per second. (If the frequency reaches hearing range, some report hearing an earthquake as a very low-pitched hum or rumbling (typically punctuated by sharp slams and/or crashes, of course).)
Quakes are enormously violent: the worst estimated nearly seven THOUSAND times more explosive than if ALL the world’s nuclear weapons detonated together at a single focus !!
Worst Earthquakes
vs.
All Nuclear Weapons Detonated Together

9,600 ↑
 gigatons ≈ 6,600 times worse
↓ 1.46

Is it possible for a human being to comprehend such vastly massive disruptions?
One can at most barely begin to imagine how powerful seismic waves can be,
able to inflict horrific damage up to many dozens of miles distant.
Such perspectives help attempting to understand how the worst quakes’ seismic waves
rocket around Earth’s entire 25,000-mile circumference up to multiple times!
Making the entire Earth ring like a bell can thus begin to seem more plausible.
The below cross-section helps illustrate how most earthquakes begin many, up to dozens of miles underground:
..hence, even at their rocket speeds,* it usually takes some seconds for the first wavefront to reach the surface above, whence humanity starts noticing something amiss.
* up to 5 miles per seccond, approaching escape velocity of a moon rocket. (Some claim higher speeds.)
As in the color image above: On Earth’s surface, each spherical wavefront generates a circle of shock energy rapidly expanding and racing outward, disrupting life in every direction (at least momentarily).
But beneath, the vast majority of each spherical seismic wave continues rocketing along inside Earth in every direction, as sketched in the next image.
The overall shape of each seismic wave thereby transforms, like a ball of wax pressed upward against a very hot screen that instantly evaporates any wax contacting it, hence:
In seconds, the sphere becomes flat on top, no longer has any upward-pointing arrows at all, as most of each seismic wave continues rocketing away in every direction inside Earth:
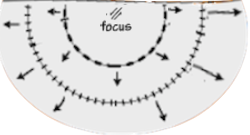
– It also thus becomes obvious why structures nearest the epicenter* tend to suffer the most damage: they are most subject to upward shock forces..
–Plus a seismic wave’s intensity rapidly diminishes as it expands and stretches ever wider, thus dispersing its forces, obviously. –
*point on the surface above an earthquake’s focus
As a seismic wavefront rockets away from the focus beneath the surface, it jolts chunks of Earth it fires through, whence some of that energy is released upward toward the surface. Waves from the strongest quakes can send upward bursts intense enough to be felt even hundreds of miles from the focus/epicenter.
The concentric red circles in the below image represent four stages as a single seismic wave races outward in every direction from an earthquake epicenter,  (near Hong Kong).
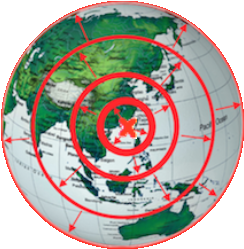
Note: Only the strongest quakes are felt on the surface farther than the smallest, inmost circle.
Crucial to keep in mind is the vast majority of a wave’s disrupting forces, its onrushing, flat-topped spherical wavefront rockets outward and away in every direction underground, inside, within our home planet. (Including the solid parts beneath ocean bottoms, of course, as indicated in the above image.)
– An informed reader knows geologists’ current theories how seismic waves spread
are far more complex than this initial sketch/overview.
– Lacking direct observations even ten miles deep, they’ve imagined complicated factors inside Earth in attempts to explain the global patterns they observe via patterns discovered just beneath the surface. For example: Refraction observed in exploring for oil within reach (up to several miles down) is believed to also occur across thousands of miles deep inside.*
Refraction Hypothesis:
Seismic Waves Follow Curved Paths
Deep Inside Earth
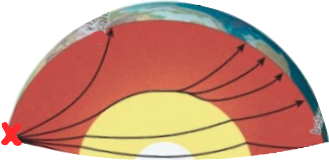
source (includes description)
– But a phenomenon geologists call the P-wave Shadow Zone, discussed below, along with another recent discovery.. actually:
* click to show | hide illustration + link
All known seismic wave phenomena seem fully consistent with the simpler picture the landmark OSU* findings reveal ( – especially once calculations of velocities† undergo revision in light of them.)
* Oregon State University
†
Velocity in Physics
Velocity is a vector measurement¹ of the speed plus direction of motion.
I.e: The speed at which something moves in a particular direction, such as the speed of a car traveling north, or the speed a rocket travels as it launches vertically into space (relative to Earth).
(The “absolute value* ” of the velocity vector is the speed of the motion without regard to direction.)
* “scalar magnitude”
(In calculus, velocity is the first derivative of position with respect to time.)

The below section of the globe indicates how a seismic wave rocketing and spreading within and around Earth would appear from the side. The very thin, vertical red line at 90º indicates how a wave’s intensity is almost unimaginably vastly stretched at that halfway point of its journey, where it encircles Earth’s entire 25,000-mile circumference, 90º distant from its origin:
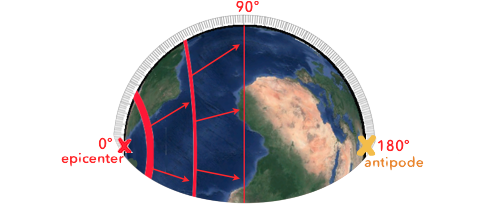
Antipode = exact opposite point on Earth
furthest away from the earthquake = 180º distant
Again: The red curves on Earth’s surface are just an indication where the front edge
of a wave is located, perhaps up to several hundreds of miles deep inside Her strata.
– Following this general overview, a fuller picture of what’s apparently happening
inside Earth is explored in detail, now much better revealed by the OSU results. –
Since a seismic wave’s intensity is maximally stretched and attenuated at 90º distant, OSU found no evidence of earthquakes triggering additional quakes there – as evident in this part of the graph of earthquake rates OSU observed around that angular distance:

“USUAL” means no change in earthquake rates at that distance
from a major quake,
hence no indication of triggering. The entire graph follows below.
The continued lack of triggering past 90º where seismic waves begin contracting smaller in circumference, hence begin reconsolidating their forces and strength on the opposite side of Earth, is partly due to seismic waves continually losing intensity as they expend energy ramming through thousands of miles of rocks and strata.
Plus, as illustrated further below, seismic wave energies get dispersed in all sorts of directions, both when encountering significant changes in the composition of strata, as well as when crossing significant fault zones* up to miles wide.
*
But another, fairly recent discovery also demonstrates Earth’s interior is a far better conduit and transmitter of seismic wave intensities than previously thought:
Increasing thickness of the three concentric, red partial circles in the below graphic illustrates seismic waves regaining intensity as they contract in diameter to reunite at their antipode,  , hence contract ever more rapidly in circumference, whence each wave’s forces steadily recombine back together, attaining maximally intense culmination at the antipode:
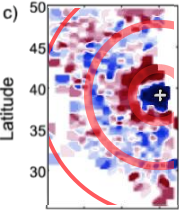
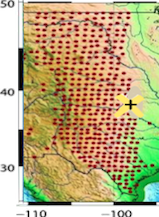
 , + = antipode
from Figure 6 of “Antipodal Focusing of Seismic Waves;” 3 red, partial circles added
graphic generated by a mobile US Array deployment of hundreds of seismometers
across the western US Great Plains: the tiny red dots in the map on the right.
The smallest of the three red circles represents the last moment before a wave slams and collapses back together in the vicinity of its antipode: marked by the “ + ” sign midway along and just inside the right edge of each illustration, at about 39º Latitude.. = 180º distant from the epicenter on the opposite side of Earth (in the Indian Ocean).
Each of the hundreds of patches of red and blue in the left image vary in intensity to represent differing seismic wave intensities seismometers detected at those locations:
The most intense and darkest colors within a handful of degrees of the antipode reveal waves are strongest there as their circumference collapses back together, whence all remaining intensity grows ever more concentrated and powerful..
This graphic thus reveals how, after rocketing beyond the aftershock region:
Seismic waves become “most likely”* to be disruptive enough to trigger quakes
when they regather and re-concentrate their vast forces in their final dash to
Reunite at their Antipode . .
as OSU’s investigation discovered.
* how OSU expressed it in the quotation beginning this page
The remainder of this web site examines how everything known about earthquakes and seismic waves is consistent with these paradigm-disrupting discoveries.
Before pressing onward, a few additional details in the above graphic deserve attention.
Paler colors demonstrate seismic waves are less intense the farther away from reuniting at the antipode, evident especially at the farthest distance in the upper left corner on the Canadian border.
(Few data points occur to the right of the antipode because hardly any seismometers
were east of it, as pictured.)
That farthest point in the array is 15º from the antipode (diagonally),
hence 165º distant from the epicenter (in the Indian Ocean); 15º is just over 1,000 miles.

The waves contract back together enough for seismometers to detect re-concentrating, reconsolidating intensity all across the entire array, from the Canadian border at the upper left to the furthest point 1700 miles distant on the border with Mexico at bottom.
These reunions thus seldom if ever cause enough shaking to be noticed by humans, but seismometers have no problem detecting waves from quakes strong enough to rocket them that far, as geologists have long known.
– Since Earth’s strata are far from uniform, one would surmise seismic waves refocus across a region that varies in size and shape at different locations.. But the above seismometer array demonstrates an amazingly focused reunion, suggesting deeper strata may be more uniform than currently thought. –
This Great Plains discovery helps illustrate another significant issue: The quake that rocketed seismic waves around the world then was much less intense than many OSU examined, just over 5 in magnitude.
OSU investigated quakes up to several orders of magnitude higher: those would have generated much, if not far more intense seismic wave reunions in the above Midwest array: Each higher magnitude number represents “about 31 times” worse disruptive force:
An 8 magnitude quake would thus have been THIRTY THOUSAND TIMES more intense!!
31 X 31 X 31 = 29,791
Also, again: Almost all seismic wave happenings are deep inside, up to several hundred miles beneath the surface (calculations below), hence not only humans are unaware of these reunions, essentially all seismometers are also on the surface (including the few just beneath in mines):
The most significant, much more intense reunions occur beyond current technology, deep inside Earth where the vast majority of seismic wave energy rockets about, as is better revealed below.
The Great Plains discovery also confirms observations quoted above how seismic waves ring Earth like a bell. Another example:
One of the worst quakes ever, the 2004 Indian Ocean earthquake, actually caused the entire Earth to vibrate continually for over four months -!- as geologists observed Earth’s surface rising up and down as much as twelve inches with each oscillation (comparable to how much the Sun and Moon’s tidal influences stretch our planet every day).
(Perhaps a giant with ginormous enough ears could have heard Earth emitting a massively deep
and sonorous tone as it oscillated, vastly humbling humanity’s most powerful bell.)
Massive Tidal Wave from that horrifically deadly quake:

from “rising..” link
All these phenomena demonstrate seismic waves continue rocketing onward after re-uniting at an antipode, where they begin expanding again almost as if another quake occurred there, thence continue contracting and expanding repeatedly as they circle Earth
– for up to months!
• Note, especially to seismologists:* Theories underlying the equations generating graphics like the one above need to be modified via the fuller perspectives the OSU results reveal, to more accurately represent seismic wave trajectories.
* geologists focused primarily on earthquakes
A baby step in that direction is sketched below.
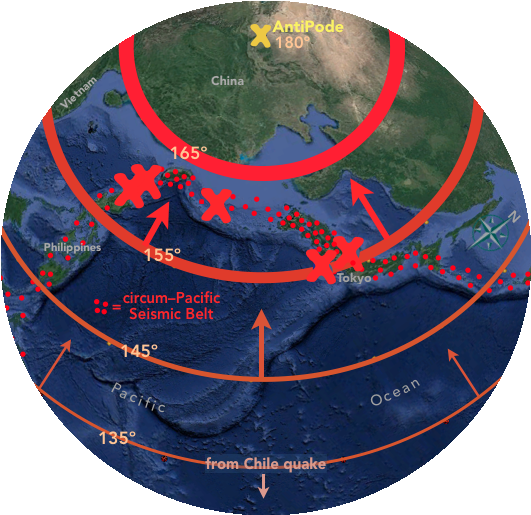
The partial globe below illustrates one example of triggered earthquakes OSU published – in this case after seismic waves rocketed across beneath the Pacific Ocean from a horrific quake in Chile: the top left, “a” example on the page linked just above.
The red curves and partial circles illustrate how seismic waves contract ever smaller in circumference as they rocket toward reuniting at their antipode . .
Whence their intense forces recombine and greatly increase, thereby disrupting strata enough to trigger quakes on the opposite side of Earth from their origin (focus)..
In this case five quakes triggered within 25º of their antipode, represented by red  es:
es:
click to keep open
in small window
based on OSU’s graphic
as illustrated on this page
..between 155 and 165º: These are quakes triggered along the Circum-Pacific Seismic Belt pictured below, encircling most of the Pacific Ocean, where a good 90% of
all Earth’s quakings occur, indicated above by the irregular band of small red dots  marking mega-quake epicenters the past century.
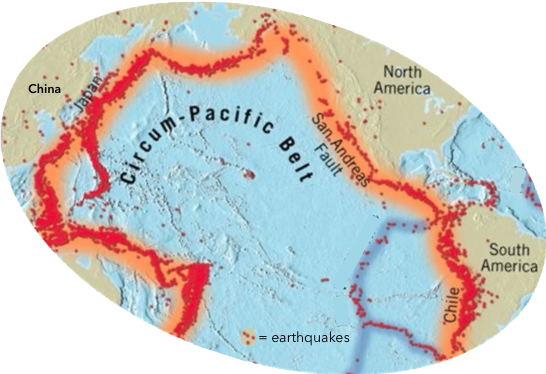
click map for source
Geologists devote vast effort to investigating this unique planetary feature, have all sorts of ideas and theories why earthquakes are so concentrated along this Belt – popularly known as the Ring of Fire because the large majority of volcanoes also occur along it.
On the above partial globe mapping five quakes in Asia, preceding positions of seismic waves are blocked from view by the curvature of Earth, but as illustrated previously: Each wave stretched maximally at 90º to encircle the entire planet, the half-way mark of its journey from its origin* to its  = the exact opposite point on Earth from the Chile epicenter, marked by
  at the top of the graphic.
* focus/epicenter
The curved red lines representing seismic waves are thicker the closer to the antipode to indicate how a wave’s intense forces coalesce and recombine back together as the wavefront collapses in circumference: After stretching to just under 25,000 miles at 90º, all a wave’s remaining intensity after forcing through thousands of miles of strata reunites and crashes back together across a relatively small region around the antipode (again: the opposite point on Earth).
Only after each wave has shrunk in circumference enough to coelesce and reconcentrate its disruptive forces back together sufficiently, only then do they become intense enough to trigger offspring earthquakes: The quake triggered at the furthest distance from the antipode, just to the left of the “Tokyo” label, occurred very close to if not exactly 25º away (at the edge of the continental plate, apparently just offshore Japan).
The above wave diagram illustrates OSU’s core discovery: Earthquake triggering occurrs most frequently near antipodes, as noted in the sentence concluding the Abstract, the first paragraph of their Nature report:*
“The region with the greatest chance of induced earthquakes..is on the opposite side of the earth, within 30 degrees of the antipode.”
* also linked above
– As is evident in the below graph of earthquake rates OSU found: The two highest rates
at 150º and 160º are within 30º of the antipode (180º ):
Changes in Global Earthquake Rates After Major Quakes
At Different Distances from Their Epicenters, in Degrees
within 72 hours

Mildly adapted,* simplified version of OSU’s graph, as described on this page.
The triggered quakes in Asia illustrated above well represent OSU finding the highest rate of triggering centered on 160º: all five quakes occurred between 155 and 165º distant from the Chile quake.
* per CC license
Although virtually the same amount of the circum-Pacific Belt between 145 and 155º was traversed by the same seismic waves, they had not coalesced back together as much, were weaker before contracting further past 155º, hence at most two quakes are evident in that range of angular distances on the map Nature published,* one in the Philippines and another in Indonesia. – OSU colored those epicenter ovals black to distinguish them from the green ones within 25º of the antipode.
* links to same illustration detail page as above
Also: The observant reader will notice the peak rate is around 15 to 20º from antipodes, but a seismic wave focuses and contracts back down to minimal diameter if not close to a single point, either on top of or within a few degrees of its antipode, as the Midwest seismometer array examined above demonstrates most obviously.
Since there are a number of wondrously unique but rather complex geographic plus seismological reasons for this seeming contradiction to the thesis of maximal seismic wave contraction, hence triggering at antipodes, those complexities are illustrated and thoroughly examined on a separate page,* thus easing burdens on this main page.
* same link as directly above (just beneath graph)
In brief: The rate of triggering peaks at 160 to 165º due to a remarkably unique geographic and seismologic configuration of the circum-Pacific Seismic Belt, which is nowhere wider than 165º: Very different geographic and seismological conditions thus prevail past 165º.
As the separate page reveals: Quakes triggered between 145 and 165º along this cPS Belt reduce stresses on the neighboring Alpide belt, thus dramatically collapsing the rate of quakes between 165 and the antipode at 180º, to almost as far below usual as the 165º peak exceeds usual !
To risk use of a trite phrase: The last 15º are the seeming exception that proves the rule.
– Readers are, of course, welcome to enjoy those numerous and extraordinary details before continuing on this primary page. –
One of the cPS Belt’s two farthest distant corners is visible on the above globe image, partially obscured by the cluster of epicenters at the 165º label (clustered on Taiwan). The arrow tip just beneath is in the corner of deep oceanic crust where the Pacific Basin stretches widest. Full details are on the “separate page” linked just above.
It bears repeating how red curves on Earth’s surface just indicate a momentary location of the foremost edge of a wave’s stretched or obloid SPHERE* of intense shock energy rocketing and reflecting deep inside in virtually endless directions, hence a quake instantly begins filling a seismometer trace..
with nearly countless waves: 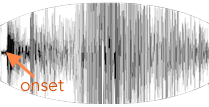
*further illustrated below.
It thus becomes easier to imagine how such a massive onslaught of rocketing waves repeatedly slamming into vulnerable strata can help trigger an earthquake, even near the furthest point on Earth’s opposite side.
After seismic waves expand beyond the aftershock region, geologists have considered them too dispersed to trigger earthquakes, as evident in this well-used diagram of seismic wave energy concentrated solely within 30º of epicenters:
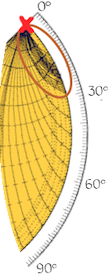
click image or here for source
The OSU discovery is heralding a new era.
– Please note the above, theoretical pattern of waves spreading deep inside Earth has been made obsolete by OSU’s discovery, as additional evidence below even more thoroughly demonstrates.
– Once all the OSU discoveries have been examined, it becomes possible to reconcile them with prior observations and theories via the new, more complete perspectives OSU made evident. –
The striking, highly significant pattern of quake rates being just usual between 90 and 130º, then accelerating upward from somewhat higher at 140º to the blatantly exceptional, outstanding peak rate just 20º further at 160º:*
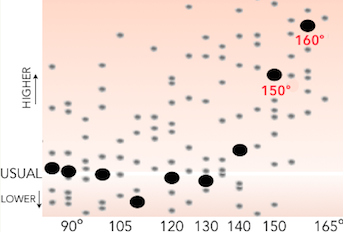
* representing rates from 155 to 165º
It is hard to imagine any other explanation for this pattern than the above globe image illustrating seismic wave intensities increasing rapidly as they contract ever smaller in diameter on the way to re-uniting, at more-or-less one location in the vicinity of the antipode – As if one were playing in reverse a movie of waves rocketing forth ever wider from their origin (focus), as an earthquake generates one of Earth’s most violent, most disruptive explosions.
The rest of this web “page” examines how geologic phenomena in general are consistent with what to currently prevailing views and theories seems mind-boggling if not ludicrous.
– Note to fatigued readers: Now that this presentation seems sufficiently thorough, we authors hope to create a simpler, abbreviated version. Rather exhausted from the past year wrestling these conundrums, we could well use assistance and support! Details at end. –
Geologists have observed seismic waves traversing Earth in puzzling ways, especially since the late nineteenth century when recording seismometers were invented.
Since the farther a wave travels, the more its energy spreads and disperses inside Earth, OSU’s discoveries demonstrate seismic wave energy does not spread in every direction throughout the planet as it would if Earth were entirely solid like a bowling ball,* as in this cross-section: as if Earth were sliced in half through its center, revealing one of the two, flat surfaces exposed by the cut:
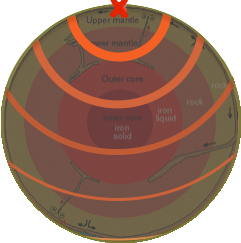
* This argument would still apply even if there are some deep regions
hot enough to be liquid, since waves are thought to transverse such regions similarly.
The aftershock region where seismic waves are well known to help trigger subsequent quakes is less than 5% of Earth’s volume,* hence, absent a massively significant focusing effect, a wave’s intensity would be dispersed or diluted to some rather if not very small % after spreading throughout the rest of Earth to reach the antipode.
* opens window/tab with calculations
Hence: In the above image, after the initial, thickest curve delineating the aftershock region, the four additional curves* representing waves continuing to spread throughout Earth are very much exaggerated: To be proportional to the diminution in intensity, the second would be so thin it would be barely if at all visible, the rest proportionately ever tinier, hence invisible (at least relatively):
* the fourth barely visible at bottom
Each curve just represents locations on the imaginary cut surface as a spherical seismic wave rockets in every possible direction, whence its intensity diminishes at a rate proportional to the CUBE of distance travelled.
Plus a wave expends energy, would lose much intensity forcing its way through thousands of miles of super dense rocks and strata geologists’ current theories predict (including zones conjectured so intensely hot to be liquid under extreme pressures).
Plus to any extent waves do reflect and refract across thousands of miles as currently presumed, each shift in direction would also consume some, hence diminish intensity.
Seismologists’ theoretical graph of seismic wave intensity in the second section below clearly illustrates the currently prevailing idea of rapid dissipation with distance.
Furthermore, it seems very if not thoroughly impossible for seismic waves to continue circling seismologists’ current models of Earth for months, as if it were a science fiction fantasy of a self-perpetuating bell.
❧ It is thus very challenging to postulate a different explanation for the OSU results than very significant conservation and focusing of seismic wave energy as it resonates within and “rings Earth like a bell,” as stated by geology authorities above:
❧ Since no one employs a dense, solid bowling ball as a bell, it is hard if not impossible to conceive some other possibility than seismic waves are very significantly confined and resonate within a majorly thin shell at least somehow analogous to a bell, surrounding much if not most of whatever else Earth is like inside. ☙
Also: As cited in the Nature report’s Introduction, geologists had previously noticed evidence of large earthquakes triggering additional quakes thousands of miles distant, including on Earth’s opposite side.
But again: OSU’s investigation is by far the most comprehensive confirmation to date.
Before exploring the even more disruptive discovery of triggering on the same side of Earth where a quake occurs, at both 45 and 75º, a few additional details help complete the above considerations:
Rethinking Seismology
At the very least, the OSU discoveries require significant revisions to currently prevailing ideas about seismic wave trajectories.
Perhaps that is part of why the authors avoided any attempt at interpreting their findings.
One point seems particularly germane for now, regarding observations of waves at antipodes rising close to straight upwards toward the surface as illustrated below
— including exactly perpendicular to Earth’s surface, the path current theories label as a unique PKIKP, imagined as a wave rocketing straight through the very center of Earth’s core from an earthquake, hence making a direct hit on its antipode:

Once one can at least begin to consider the possibility seismic waves resonating and reflecting inside Earth – like pressure waves confined within and vibrating the metal of a ringing bell – are majorly, if not entirely confined within some such outer shell.. thence the waves contract ever smaller in diameter in their final rocket dash to reunite back together in the vicinity of their antipode, as illustrated above . . (click to show | hide graphics)
..it becomes obvious little if any significant seismic wave energy is penetrating very deeply, much less all the way through the center of Earth, thence onward to the opposite surface.
8 Quakes potentially Triggered in Asia by Chile quake:
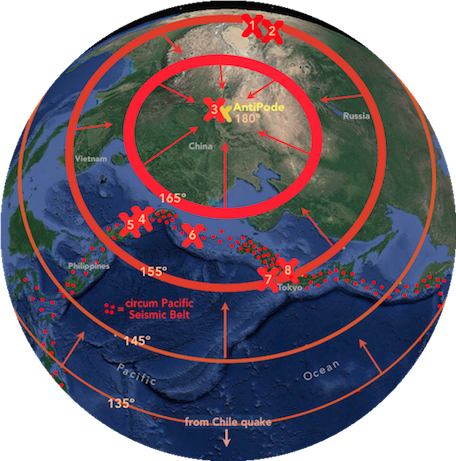
(The three additional quakes at top are discussed on the detail page.)
Antipodal Focusing of Seismic Waves

Evidently vectors* rising straight up toward seismometers at antipodes – labelled PKIKP, as above – such vectors rather result from seismic waves contracting ever smaller in diameter until they collapse and re-unite back together at more-or-less one point beneath their antipode. (That point apparently no larger than some small number of degrees across, generally, as evident in the earlier illustrations above of waves contracting across the Great Plains seismometer array.)
Such a head-on collision creates a new focus of shock energy spreading in many if not every direction, including straight up :
*
Velocity in Physics
Velocity is a vector measurement¹ of the speed plus direction of motion.
I.e: The speed at which something moves in a particular direction, such as the speed of a car traveling north, or the speed a rocket travels as it launches vertically into space (relative to Earth).
(The “absolute value* ” of the velocity vector is the speed of the motion without regard to direction.)
* “scalar magnitude”
(In calculus, velocity is the first derivative of position with respect to time.)
Hence, waves rocketing vertically straight up at the antipode are also consistent with a thin shell, just originating from collisions/collapses of wavefronts back together some dozens to hundreds of miles deep.. Not from waves passing all the way through Earth’s center from its opposite side:
No such vectors are the final stage of a wave that transited Earth’s center from the focus: Virtually if not all such possibilities are now precluded by OSU so thoroughly confirming seismic wave energy is so massively conserved in a bell-like shell.
Rather, it’s as if another earthquake occurs directly beneath the antipode, generating all such vertical wave trajectories.
See below for another phenomenon consistent with waves expanding maximally to 90º and then contracting back together inside Earth’s shell, what seismologists call the P-wave Shadow Zone.
While OSU’s report emphasizes the unexpected discovery of frequent triggering near antipodes . .
Any attempt to understand how seismic waves trigger quakes on Earth’s opposite side must also include triggering OSU discovered on the other, the near side of Earth
‐ the maximal paradigm buster ‐ centered around both 45 and 75º from epicenters, thousands of miles beyond what was heretofore considered the usual limit of aftershocks:
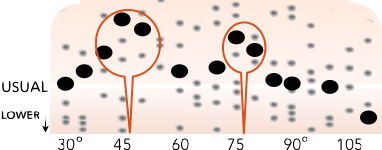
Changes in Global Earthquake Rates after Major Quakes
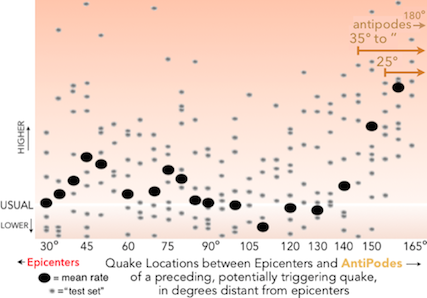
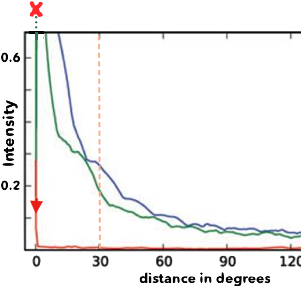
As evident on the left side of the below graph, currently prevailing theories predict seismic wave intensities rapidly weaken with distance from the epicenter at 0º :*
 †
†
*and some collapse = red down arrow
† top 1/3 of graph truncated on source
By the time waves reach the vertical orange dotted line at 30º distant, the two theoretical curves remaining above negligible intensity have diminished by over seventy percent, and continue dropping thereafter.
– Hence, OSU’s protocol ignored quakes in the usual aftershock region: within 25º, since examining rates of distant quakes beyond the aftershock region was their aim. –
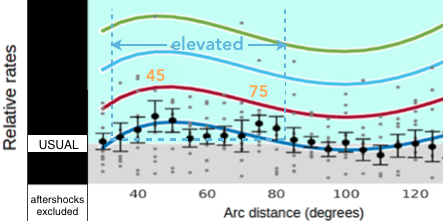
But OSU found the opposite trend: Rates of quakes rise rapidly from the “USUAL” background rate at 30º in the graph above, to a peak around 45º, thus sending geology even further back to thinking caps ( ± chalk or white -boards) . .
. . not least because the database includes so many thousands of quakes: The probability curves in OSU’s graph* thus affirm significant shifts in the overall trends there, clearly unreasonable to deny.
* click to show | hide curves on graph
Elevated Rates and Probabilities at 45 and 75º
(rest of graph examined in a later section)
But 45º is just the first seesaw rates rode back upward: OSU found almost as high a rate peak nearly twice as far, at and just past 75º:

(probability curves removed, obviously)
These two rate peaks stand out prominently above the rest of OSU’s graph – before the gradual rise to the peak in the antipode region, of course.
While, as illustrated earlier above, geologists do currently acknowledge some antipodal focusing of seismic waves – though much less than OSU revealed..
❧ No current theories predict nor support focusing at 45º nor 75º. .
And especially not in the face of a LACK of triggering between them. ☙
45º from the triggering quake’s epicenter is more than three thousand miles distant:* – one-fourth of the way ’round to the antipode (again: opposite point on Earth).
* 360º / 45º = 8 → Earth’s circumference: 24,901 / 8 = 3,113 mi
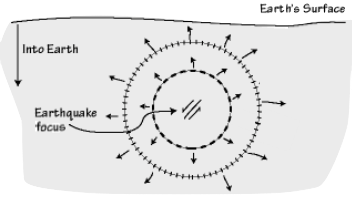
Crucial to keep in mind are the first three illustrations* of seismic waves demonstrating each explodes into a very disruptive, more-or-less spherical wavefront rocketing along deep inside Earth, in every possible direction.
* click to show/hide images



The simplest ways seismic shockwave energy could focus and concentrate enough to trigger earthquakes thousands of miles from its epicenter are:
Especially the more downward and inward -rushing parts of each wave reflect off deeper strata back toward the surface, where they recombine and focus back together with other parts around twice as far away – as in this sketch how that could occur inside some sort of outer shell confining much, if not most seismic wave energies:
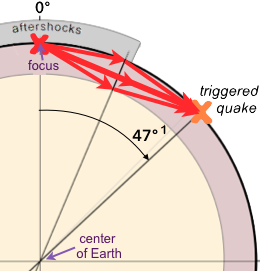
Note especially for seismologists: These vectors are straight lines because refraction needs rethinking in light of the OSU results: Vectors on this site just indicate origin and destination, neither deny nor exclude refraction: Termination arrowheads are either where the evidence indicates seismic wave energy is triggering quakes, or where a vector may be reflecting. Similarly: An arrowhead in the middle of a vector just indicates overall direction, not a particular path from origin to destination: as in the longest of the arrows above.
¹ OSU charted rates every 5º, but the rate at 50º * is higher than at 40º,
hence the peak rate was likely between 45 and 50º. *see next image below
For any reader who thinks like we authors, the channel seismic waves are confined and reflect in above looks amazingly, if not unthinkably narrow.
But the next segment of the rate graph indicates minimal if any triggering occurs for the next 20º, starting at 55º:
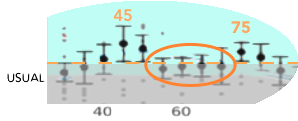
60º is halfway between 45 and 75º, and seismologists often label a seismic wave trajectory detectable there, hence there must be some sort of hindrance or blockage preventing significant shock energy from focusing around 60º:
At least a major and/or more than one vector evidently encounters significant resistance between an earthquake focus and 60º distant.
Since seismic waves are so powerful, however, it is hard to imagine a change in the composition of Earth’s rocky shell that would so thoroughly block waves that can break steel.
But the OSU discoveries make it hard to avoid the idea Earth has some sort of barrier like the inner surface of a bell, somehow able to keep seismic waves confined within a narrow shell, preventing them penetrating deeper, to at least some significant extent.
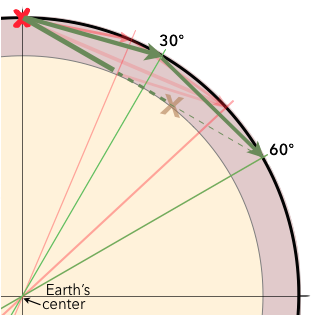
In the below image there are only two major vectors that could possibly make it all the way to 60º in a shell this thin, both green: one that reflects off the inside of Earth’s surface at 30º, plus a direct vector on a single straight line* from the focus to 60º:

* Since perception can distort geometric relationships, a straight edge
may be needed to verify the dashed lines are a continuation of the solid line.
(These three segments form a tangent to the inner circle at 30º, halfway to 60º.)
The vector reflecting back inside at 30º is analogous to the vector in the previous image reflecting at the surface about 23 to 24º from an epicenter, then crashing back against the surface the same angular distance farther around 47º.
But while that reflection around 24º is within the usual 25º aftershock region noted above, 30º is 20% farther than aftershocks are known to occur, nearly 400 miles farther, plus OSU observed no evidence of significant triggering occurring at 30º.
Furthermore: The direct, non-reflecting vector slams right along the apparent inner barrier for many hundreds if not well over a thousand miles, hence those forces are eventually exhausted and fail to ram all the way back to near the surface where quakes occur.
The lack of rigidity inside Earth preventing drilling equipment penetrating even eight miles may also be a contributing factor. Such unexpectedly high temperatures so close to the surface make it likely there are much higher temperatures hundreds of miles deeper, hence even under enormous pressures, strata may be too malleable to act like a rigid sounding board, perhaps more resemble a wet sponge readily absorbing and exhausting seismic wave energies, analogous to soft and malleable sound-proofing.
Consistent with this conjecture is geologists surmise Earth is too malleable below about 200 miles for strata to be rigid enough for shallower type quakes to occur. Greater flexibility would allow strata to warp and flex as necessary, hence any faults would not get locked up as rigid strata do.
(Whence forces eventually accumulate enough to violently rupture,
at least somewhat reduce the blockage = an earthquake, of course.)
Most quakes occur within roughly forty miles of the surface.
Parts of seismic waves with different trajectories, rocketing away from the focus at more acute (smaller) angles, might manage to focus at 60º by reflecting more than once – more times than in the above images – but any such trajectories would not only be longer than a direct, straight path, hence drain more of a wave’s forces to travel as far around Earth:
A force must also expend a significant amount of its energy to change direction. Hence, the longest, direct arrows, the non-reflecting vectors in these diagrams, are drawn thickest to indicate they are the strongest, most disruptive vectors, do not lose energy nor intensity like the other trajectories must when they are forced to reflect, to change direction.
There seems no alternative explanation for the pattern of triggering OSU found than Earth having an astoundingly thin outer shell where much if not most seismic wave energy remains confined somehow.
The theoretical vectors in the previous diagram possibly triggering quakes at 45º are faintly represented in the above 60º diagram, demonstrating the direct, non-reflecting vector from a focus to the surface 45º distant does not encounter an inner barrier in a shell this thick.
The bottom edge of the above shell is at a depth preventing vectors rocketing directly from earthquake focuses to the surface region within five to around ten degrees of 60º distant, hence rates of quakes at those data points are at most minimally, apparently not significantly elevated above usual.
Although necessarily preliminary, the above considerations and diagrams indicate the depth of the shell seismic waves reflect and/or reverberate within is only about 14% of Earth’s radius, as the rest of the above 60º diagram demonstrates:

Mind-boggling, maximally unthinkable as it may be, it is now at least arguable we humans walk and dwell on some sort of configuration at least somewhat analogous with a bell, somehow confining seismic waves in an outer shell perhaps little more than 500 miles thick:
0.14 × 3959¹ = 554 miles.
That depth is consistent with the greatest depth seismologists have so far calculated for an earthquake focus, somewhat less than 500 miles (736 km).
* click to entire 60º image
A colossal mystery has just become glaringly obvious:
¹ source (also linked at top)
What is the vast majority of Earth beneath ones feet like? ?
Particularly these unchanged, just usual rates of quaking around 60º seem the lynchpin demanding lots of re-evaluating, rethinking what geologists observe.
Again: The bell analogy suggests a reflecting limit and/or barrier something like, at least somewhat analogous to the interior surface of a bell.
Also again: If seismic waves actually do refract significantly deep inside,* the above calculation might well require adjusting accordingly.
* below depths accessible to Geological Engineering
For sure, much re-thinking is needed; this site can only make preliminary estimates at best.
An outer shell 14% of Earth’s radius in thickness leaves the radius of the unknown beneath, surrounded by the outer shell, at 86%. That equates to just under two-thirds of Earth’s volume, 64%, unknown, apparently very much if not entirely impenetrable by seismic waves.
As mentioned, also needing consideration is the evidence of quakes triggered somewhat further distant, centered just past 75º:

– Hopefully, dear reader, you have significant stamina left, for this next segment not only
must reconsider the several factors addressed above, but additional ones as well.
– The good news is the end of this convoluted tunnel of arguments is now in sight. –
Firstly: Since 75º is 30º farther than 45º, plus no evidence of triggering was found at 30º, any additional waves originating from impacts near the surface at 45º seem excluded as potential contributors to these further quakes evidently triggered 30º past 45º = at 75º.
Next: Although in the apparently thin shell waves resonate within, none of these 78º group of vectors are able to fire straight all the way to the surface like the solitary, non-reflecting vector targeting 47º :
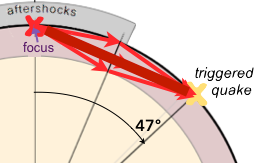
..hence theoretically have to reflect up or down – at least once, around 39º, as illustrated above – they face no impediments like the vector aiming straight for the surface at 60º that some sort of deep hindrance apparently absorbs or otherwise blocks.
Even though the 78º vectors have to travel farther, and there is no single direct line between the focus and the region around 78º, seismic waves apparently focus major disruptive energy there, well over 80%* of the way to halfway around Earth (halfway = 90º from the originating quake, of course).
* 78/90 = 87%
78º is over 5,000 miles from the waves’ origin at the earthquake focus! plus over three times further than what seismologists consider the usual aftershock region: 25º.
Since these waves reflect farther along inside Earth plus travel farther than those focusing around 45º, they lose considerably more of their intensity smashing through thousands more miles of bedrock, plus especially due to stretching much wider to encircle a much larger portion of Earth: at 78º the waves are close to stretching widest at 90º, the halfway mark on their rocket ride to reunite at their antipode.
Hence, triggered quakes are less common around 75º compared to 45º:

If some sort of configuration resembling a bell is responsible, so many triggered quakes around 47º and 78º, plus the lack of triggering at 60º: these three patterns altogether suggest if not demonstrate the relatively, actually astoundingly thin shell calculated above.
The lack of triggering on both sides of the elevated rate of earthquakes clustered at 45º is an additional indication of focusing there:
Since focusing closer than 45º would require reflected waves to reflect at a greater, rather than more grazing angle, any such reflected waves lose more energy due to encountering the barrier at a more acute angle:
The less acute, the more glancing an impact, the less energy is lost in reflecting – as anyone who has practiced skipping stones on a pond can attest.
That may also be part of the reason for triggering around 75º: Waves reflecting at close to 40º reflect at significantly smaller angles than those arguably blocked from reflecting to reach loci within 45+ º (see illustration below), hence more distant reflections apparently retain enough shock energy to disrupt when they return to the surface thousands of miles farther than those focusing at 45º.
A further confirmation of the above geometries is geologists know it takes seismic waves significantly longer to travel from one side of Earth to the other than a direct path through a solid Earth would.
While geologists have imagined various ways seismic waves get deflected, slowed, and/or follow curved, “refracted” paths deep inside Earth, having to reflect at least a few times within shell boundaries offers a similar explanation for observed travel times.
Also: If significant refraction does occur in these vectors triggering quakes at 45 and 75º, it would simply adjust the above diagrams accordingly, likely resulting in a different estimate of the thickness of the shell confining seismic waves ( – or at least containing and reflecting their energies to very significant extent).
The OSU results and the above considerations indicate there are very few if any shortcuts, evidently solely the long way ’round from one location to the exact opposite point on the other side of Earth, within a mind-bogglingly thin, shell-like layer confining and focusing much if not most seismic wave energy, arguably less than 600 miles thick.
While seismic waves focusing at 45 and 75º but not at 60º seems a compelling if not inescapable argument for an amazingly thin shell, another puzzle is the absence of triggering at 30º, just past the usual aftershock region.
– As humanity grapples with all these unexpected results, many details will likely become clearer. –
One factor possibly helping explain the lack of triggering at 30º is the angle of reflection from the inner barrier at 15º is too acute, just as a flat stone will not skip if it hits the water too steeply. This possibility is indicated in the below graphic by the ? mark deep beneath 15º:
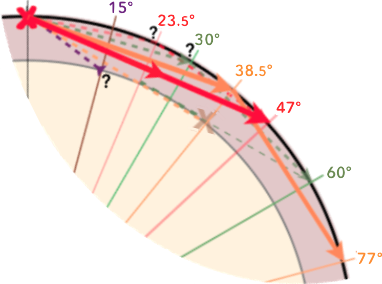
The other two ? marks in the above diagram indicate another possible if not likely factor is waves either do not reflect much, if at all off the outer crust at 15º, or perhaps not at all at any angular distances less than 35º or so..
And / or they do not persist traveling as far when rocketing along so close to parallel beneath the surface. One could for instance imagine less pressure from fewer miles of strata above a seismic wave allows more of its force to deviate or leak upward, off the direct course. And/or waves do not propagate as far in less denser strata closer to the surface.
Geologists may already understand this phenomenon well: They distinguish between “Body Waves” rocketing in every direction inside Earth vs. the very different sorts of “Surface Waves” rocketing along it, generated when body waves impact Earth’s surface: per Wikipedia and numerous other authorities.
An additional factor also discussed above is the extreme temperatures inside Earth: The major reason drilling could not proceed farther past the record 7.6 miles depth noted at the top of this page is the strata were no longer rigid, acted “more like a plastic than a solid, and the hole had a tendency to flow closed whenever the drill bit was pulled out for replacement,” just as metal is more bendable when hot: Hence, it became impossible to maintain a straight enough bore for the drill string, just over seven miles beneath the surface!
Again: Hotter, more maleable strata is also more likely to absorb seismic wave energy, analogous to softer materials absorbing sound waves.
It thus may well be the vectors reflecting off the inner barrier in all the above diagrams do not actually occur, because the strata are too soft to reflect hundreds of miles deep, rather simply absorb the shock energy, similar to soundproofing.
A final point on these vector diagrams is the lack of reflection by the 47º vector: It would next reach the surface twice as far at 94º, but, as noted previously: no evidence of triggering was found around 90º, presumably because waves are maximally stretched to encircle Earth’s entire circumference at that distance, hence their intensity is greatly if not maximally reduced then.
Reminder: As noted above, this site’s additional page demonstrating how OSU’s rate graph was adapted provides additional confirmations of these geometric and angular realities.
Reflections on Seismic Waves
All these considerations open new possibilities for understanding our home planet, including how seismic waves actually spread and rocket around inside it:
Earth’s strata are far from uniform: As seismic waves rocket and crash through numberless separate chunks of rocks and strata, each new surface or fault becomes an additional origin for seismic waves raying out from that locus.
It is hard to imagine the vast complexity how countless spherical waves of energy blast outward and away in every direction from an earthquake focus:
source
..with parts of each wave’s energy splitting off as it reflects and reverberates at countless surfaces, plus interfaces between strata with different compositions and densities.. virtually endless times in Earth’s outer shell, in every possible direction:
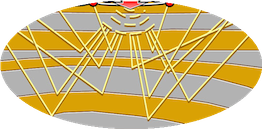 source
Note: Such sketched arrows just represent primary directions (vectors) the intense energy waves are rocketing in.
The below cross-sections are simplistic sketches of some possibilities how the spherical wavefront of each seismic wave might spread and reflect within Earth’s shell.
– For simplicity, these diagrams assume there actually is significant reflection at the inner barrier, as occurs near the surface, what exploration geologists exploit.
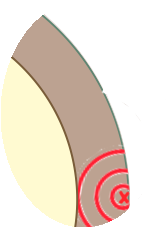
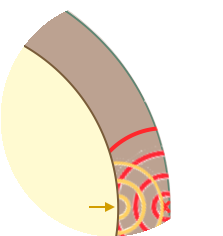
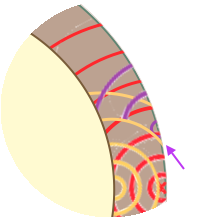
Each sketch represents a phase as a wave would rocket and expand from one side of Earth’s shell to the other if Earth were uniform inside like a bell cast from molten metal.
The left-most image depicts the progress of one wave racing and expanding at rocket speeds in every direction away from an earthquake’s focus,  , just beneath the outer surface we humans dwell on.
The other two images illustrate the wave reflecting off a single point of contact with one of the surfaces of Earth’s shell: off an inner surface in the second image generating a yellow phase from the first reflection.. That yellow phase then reflects at Earth’s exterior surface in the third image, generating a third, violet trajectory.
The first contact point, at the arrow in the second image, is opposite – actually directly beneath – the focus, whence much of the wave’s energy reflects off Earth’s inner surface, generating the tiny yellow curve nearest the arrow, the first stage as the yellow wave begins rocketing wider in every direction.
The yellow wave then crashes into and reflects off Earth’s outer surface in the third image (on the right), generating a third wave, violet, at the arrow of the same color.
Note: The shell in these sketches is about twice as thick as the OSU discovery
indicates: the waves would otherwise be more crowded, harder to distinguish.
Since the yellow wave impacts Earth’s outer surface mainly at acute angles, its energy generally reflects farther onward and away from the focus, indicated by the violet curves not extending the full width of Earth’s shell at first..
Here’s a slightly more complete picture what is happening beneath the surface, though still hugely simplistic and diagrammatic:

In reality: By the time the first violet waves in this cross-section get triggered and begin rocketing onward, the roughly spherical region of Earth’s interior bordered by the onset of violet waves would be full of seismic waves rocketing about in multiple directions, as the next cross-section sketch below indicates:
Each curve of the same color represents just one instantaneous position of a single, spherical wavefront as it rockets through and reflects in countless ways within our planet, in around fifteen minutes exploding from its focus to the edge of the image roughly 4,000 miles distant..
One also needs to keep in mind the above cross-section is just a very thin, vertical slice of the solid, curved disc shape the rounded front of each wave assumes as it rockets along inside Earth, somewhat similar to a frisbee, but with a steeper, higher dome, more like a beret:


Up to many hundreds of such explosively intense waves rocket outward in every direction from a single earthquake in just seconds, each single wave reverberating and reflecting myriads of times in nearly endless directions inside Earth’s shell, as in this rough sketch of waves exploding from an earthquake focus: the largest  about 32 miles deep:
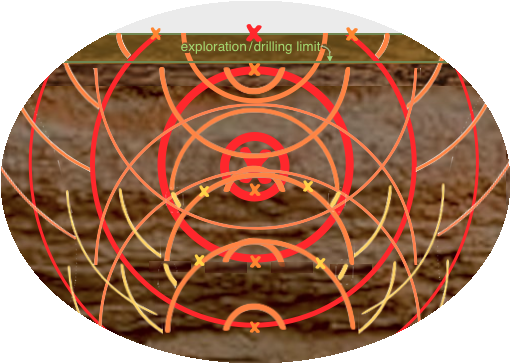
All the other, smaller X’s represent what are in effect new focuses where waves encounter and reflect off a significant barrier or shift in strata, that thus becomes a source of additional waves traveling in different directions.
The first wave is red: Each of its four† red concentric circles represents a stage as its sphere of shock energy expands, rocketing outward and away in every direction.
Whenever part of a red wave encounters a significant change in strata, some of its intense energy reflects, generating an orange wave. Orange waves subsequently generate yellow ones: the last reflections illustrated in this sequence. – Only a very few reflections are shown, for simplicity.
† The fourth red circle is barely visible close to each side: thin, bowed lines aiming out and somewhat down.
Earth thus becomes filled with countless reflections of seismic wave fronts criss-crossing each other at supersonic speeds as they reflect virtually endlessly within its rocky strata, similar to sound in a reverberation chamber, or shockwaves racing around and reverberating inside the walls of a bell.
One can thus begin to grasp why seismometer tracings are crammed with LOTS of shaking:
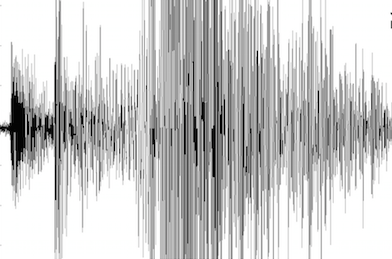
A quake repeatedly jolts Earth, up to many hundreds of times over numerous seconds, each jolt generating a wave of disruption rocketing outward in every direction, plus reflecting and reverberating virtually endless times as it spreads ever wider and farther from its focus:
When such a wave swarm stretches to encircle the entire Earth halfway around the world from its focus origin, one can imagine its most advanced wavefronts combining to form a shape something like a swim ring, or a bunt cake with a huge hole in the middle, as the swarm begins contracting ever smaller in diameter/circumference during the final rush to re-uniting more-or-less at the antipode:

Note: This image depicts a thicker outer shell than the results indicate.
– Hopefully, dear reader, you can forgive the analogy between a sweet pastry
and something as horrifically destructive as an earthquake! –
A Planetary Jackhammer
For hours to many days, the hundreds of initial, plus countless offspring seismic waves generated by virtually endless reflections, this vast, teeming swarm of shock energy races headlong through and around Earth’s shell.
Around forty minutes after a quake starts,* the first seismic wave finishes contracting to focus near or at its antipode, where its massive energies reunite, recombining whatever intensity remains to slam back together, analogous to a colossal jackhammer disrupting the status quo ‐ Mostly deep inside as discussed below, hence such reunions are seldom if ever felt on the surface above.
* 5 mi/sec takes about that long (12,500 / (5 × 60 × 60) )
12,500 / (5 * 60 * 60)
Since OSU also found triggered quakes mainly if not exclusively occur after the first 24 hours,* it evidently takes repeated strokes of these seismic jackhammers to disrupt strata enough to trigger remote quakes.
* noted in the “Temporal Patterns” section of their report
(just before the Discussion section).
The Full Picture Comes into Focus
Perhaps the frequency graph’s final revelation is the similarity, near mirroring between the region on the left where seismic waves are most intense near their origin, reflected in the steady increase in triggered quakes on the far right side:

*Aftershocks estimated: Not present in the source: Added to aid comprehension. (Seismic waves are obviously most intense there, but aftershocks were not the focus, hence excluded from OSU’s graph.)
The symmetry occurs as seismic waves contract in circumference as they converge on the antipode, as illustrated previously, including via the quakes in Asia* triggered by the horrific Chile quake.
*

As the remaining shock energy becomes ever more concentrated within a rapidly shrinking volume inside Earth, whatever intensity remains after ramming through thousands of miles of strata increases at every point along a wavefront.
Hence, as seismic waves in the right 45º region contract in circumference, thus rapidly increase in intensity as they converge on their antipodes at rocket speeds, their ability to trigger quakes rises until the final, peak rate.
– Again: The exclusion of data from 170º to 180º is explained on the Details page.
In addition to seismic waves increasing in intensity due to shrinking circumference, hence proportionately a much greater decrease in the partially spherical surface area their forces are distributed across as they contract in their final race to the antipode..
there are likely additional focusing effects due to continuing reflections in the shell confining them, similar to harmonic resonances in a bell or other resonant object, as sketched in this hemisphere cross-section :

The shell in this image is also exaggerated in thickness for clarity.
And again, there may not be any significant reflections of shock energy
other than around every 37 to 45º; the other reflections are at best speculative.
The apparent focusing of waves at 135º in this sketch corresponds with triggered quakes at 135º in the graph above, resulting from a continuation of the same focusing harmonic that produced the first spike at 45º.
Waves focusing around 75º (as illustrated above) may also reflect onward to focus again 75º farther at around 150º, thus reinforcing the increase in triggered quakes in that region.
The graph also indicates focusing starting just before 35º where the incidence begins lifting toward the 45º peak. That might be a result of focusing off layers of strata not as deep as what seems the inner limit, or perhaps just direct vectors becoming able to aim straight from the focus to Earth’s surface by around 33º or so.
Finally: Reflections from the 35º region, particularly at 37.5º, would be harmonic with the next peak twice farther at 75º, as also noted previously
Reframing Seismology
As discussed above, the overall fallow ground either side of 90º in the graph, from about 55º to 130º,* is where a seismic wave’s energy is maximally, really vastly stretched and spread along its wavefront: at 90º it stretches to encircle Earth’s entire circumference: just shy of 25,000 miles.
* average(55,130) = (55 + 130)/2 = 185/2 = 92.5
Geologists’ theoretical graph* noted above also acknowledges intensities at minimum just beyond 90º.
* click to show | hide graph
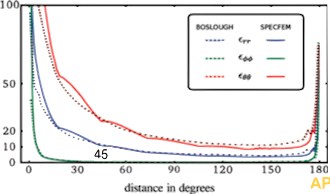
When maximally stretched around Earth’s entire circumference, a wave’s force, hence ability to shock Earth is vastly reduced, something like a thousand times less – a ballpark guess.
Hence: No significant rates, no discernible pattern of triggering was evident within the mid, fallow range of degrees centered just past 90º:

Seismometer networks also cease detecting deeper seismic waves (“body” waves) past 90º from epicenters, by about 100º where the waves have lost so much intensity in what seismologists call the P-wave Shadow Zone:
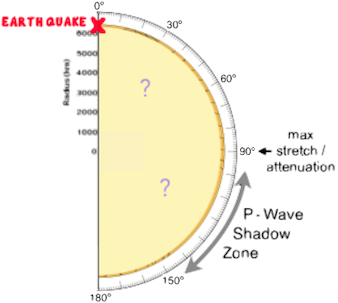
As these deeper waves then continue shrinking in diameter in their race toward the antipode, however, their intensity eventually increases sufficiently for seismometers to begin detecting them in the last mad dash to the new ground zero near 180º.
Although the waves are also continually losing intensity from having to force through Earth’s rocky strata, by about 142º, seismometers at that distance resume detecting the waves as their force and intensity becomes ever more concentrated and intense, until a wave’s remaining force slams more-or-less back together near the antipode.
But seismic waves growing strong enough to again trigger earthquakes by at most 135º is further confirmation the real action is deep underground where seismometers cannot go: they do not start receiving any indication of all the tumult beneath them for almost another ten degrees.
This phenomenon also suggests things are quite different beyond the limit humans can explore. It may well be what is physically reachable in the several miles of crust known so far is not very representative of how things are just several more or at most a few dozen miles deeper.
There seems little doubt the main happenings are miles deep, beyond the reach of drill bits. Whatever seismometers detect, even in the deepest mine or cave locations, are likely more scattered offshoots from the main regions or channels seismic waves travel in primarily.
Also: The differences known between continental and oceanic crust may well be signaling continental crust is more an exception than presently acknowledged, more than just being a minority of the crust.
Revisiting the concept of the Mohorovičić Discontinuity with these fresh perspectives the Nature results provide might well prove fruitful.
A more sideshow point with no significance to this site’s thesis is addressed on this page, suggesting why triggered quakes were more likely to be greater in magnitude, worse than the average of quakes in general. (Larger quakes have been locked up longer; lesser quakes are well known to occur more commonly, hence large quakes had no significant influence on faults that were more regularly releasing tension via less intense quakes.
Completing the Picture
As noted above, minimal if any triggered quakes occurring within 24 hours compared to the 72 hour window demonstrates most triggered quakes occur between 24 and 72 hours after the initial quake. Plus, as also noted above, seismometers detect waves circling Earth many times, an awesome demonstration how powerful a punch they have.
Since reunions at antipodes somewhat resemble a new earthquake focus, it is conceivable as waves continue their journey, somewhat like turning inside-out to begin expanding again as they continue racing onward and away from uniting near or at antipodes: Their continuing trajectories repeat the same patterns of focusing at 45, 75, then contracting from maximum expansion at 90º to minimal diameter at 180º distant from when they came to a focus at the antipode of the quake that spawned them initially: that is, as they rocket toward reuniting again in the vicinity where they originated, at the originating quake’s focus.
Since waves are known to continue circling Earth for up to months ‐ even though each circumnavigation of the globe will consume, hence diminish some intensity ‐ multiple trips circling Earth in the first few days may well reinforce the rates of triggering OSU observed, as well as help trigger additional quakes in the traditional aftershock region:
On the reverse trip back toward their origin at the focus, waves focusing at 45º would help trigger quakes 45º from antipodes, hence help reinforce the pattern of increased rates at 135º (180 − 45 = 135).
After stretching maximally at 90º from antipodes, waves focusing at 45º further would be focusing at 45º from the focus, hence tend to reinforce quake rates there as well.
Also: A lack of waves expanding from antipodes refocusing back together at 75º from reuniting at their focus origin may also help explain the greater rate of triggering OSU detected at 45º than at 75º: 75º is 105º from the antipode, within the fallow distances OSU found around 90º from epicenters.
In Summary
The numerous details and considerations above indicate seismic waves are majorly confined in a bell-like shell, most likely only dense and rigid enough some dozens of miles beneath the surface to confine significant seismic wave energy like a rigid, metal bell..
..and perhaps as narrow, as relatively thin as somewhere around 500 miles thick.
What’s Next?
Anyone even superficially familiar with physicists’, including cosmologists’ ideas about the nature of the universe will appreciate what a very disruptive game changer OSU’s findings are, indicating some sort of configuration within Earth forcing seismic waves to act in ways consistent with, at least analogous to a bell.
Theories regarding forces involved in the Moon orbiting Earth, and Earth orbiting the Sun, for instance, are based on assuming Earth is essentially a massive jumble of rocks and minerals throughout, including deep layers imagined in a superheated, more melted or liquid state.
But the earthquake evidence indicates there is some sort of barrier hundreds of miles deep preventing seismic waves from penetrating further, confining them within an astoundingly thin shell.
Since the Sun also exhibits at least a few unexplained phenomena, rather perplexing if not mind-boggling mysteries, perhaps rather much broader, much more comprehensive perspectives and understandings are needed to better and more fully comprehend Nature, the Universe, and matter in general.
An outer shell confining such explosive forces not only disrupts current theories about the cosmos and its forces: At least as, if not more disruptive is trying to imagine how Earth came to be this way.
Current theories posit gradual accumulation of matter in a focus that attracted additional materials over time, analogous to bits of iron attracted to, thence clinging to a magnet.
Hence, theorists currently believe Earth is not only entirely full of matter throughout, but also exceedingly dense deep inside, the greater the depth the greater the density.
A shell confining seismic waves thus wipes clean cosmologists’ current whiteboards.
How in the world did such a configuration come to be . .
? ? ? ? ? ! ! !
Plus theories about gravity and/or space-time assume Earth full of matter = more ? ! ? !
Since such issues are not only beyond the primary aim of this site to examine the earthquake evidence, but also beyond the expertise of its authors, it is time to conclude this effort.
— Other than any revisions or other improvements to the evidence and theses herein.
That is all this site feels up to handling or mentioning, at least for now..
– Except expressing curiosity how much the authors, as well as the Nature reviewers of their paradigm-shattering submission noticed how disruptive it is.
All of them completely avoiding even hinting the results might affect ideas about Earth’s internal structure suggests at least some anticipation, if not trepidation.
* — *
About this site
Includes contact info:
We heartily encourage any and all feedback, flames, whatever:
Coming to terms with this mind-boggling revelation may well occupy humanity for quite some time.
Any way this site can be better at serving and facilitating these adjustments is a joy to us.
Now that this thesis seems complete, we hope Life makes possible a more Reader’s Digest version. If interested in assisting, we welcome contributions and suggestions.
A version adapted to tablets is also needed.
Since these realities are timeless, we have removed a date stamp.
A few significant polishings Fall 2019 are listed on this page.
Updates
Although the site seems rather much finished now, any further significant insights or comprehendings will at least be indicated on the first screen.
Gratitude
To our minds, this site is a very humble tribute to the initiators, creators, and authors of the incomparably ginormous Nature revelation.
What stupendous gratitude all humanity owes you! On our knees!
As well no doubt also owing to the supreme assistance of its most stalwart and eminent publisher..
Plus also owing to the worldwide brother and sister -hood of geologists ever monitoring and addressing the quake threats for all of us, best humanly possible!
In addition to sources credited above and on other pages, we also acknowledge:
How much more ignorant multitudes would be without Wikipedia! Hugely grateful for so many helpful articles, especially in geology, plus math and geometry we hadn’t needed so intensely before! Such great gifts by so many to humanity!
Plus for great searching by DuckDuckGo: Talk about hitting the target!
Plus huge gratitude to NameCheap not only for such affordable hosting, but for so patient and expert support if not like heaven: closer than any ever experienced before!
Hardware and Software:
Gratitude especially for Apple Computer – details below – plus BareBones Software for providing THE imperial html platform, supported with major heavy lifting by indispensable Ondesoft ScreenCapture, a perfectionist’s divine dream, plus delightfully masterful MacRabbit’s CSSEdit,¹ as well as the indispensable Butler for creating dozens of html, css, plus other macros.. plus so simple and elegantly reliable uploads via CyberDuck.. as well as significant assists from iMazing, indispensable Keyboard Maestro and DefaultFolder; SoftRaid for ever-safe storage, with fabulous, virtually instantaneous support, 1000% brotherly.. plus CarbonCopyCloner keeping thumb drives ever primed, the files thus ever safe regardless what might befall the Apple desktop, as well as Temperature Gauge Pro so elegantly preventing the Mac melting down,² still alive and kicking years of heavy use later!
¹now supplanted by Espresso.
Google Earth plus Apple Maps were indispensable, providing virtually endless options for map images.
Thanks to Thunderbird for email.
²not least via alerting when CPU wants to boil eggs!
Apple apps were indispensable: Most graphics were created with Pages, including modifications to graphics appropriated from the web. Preview provided numerous assists in many ways. Only a tiny bit of the heavy lifting Numbers provided is visible on the site.
Also a big shout-out to Rahul Arora for the oval splash message (modal) on page open: Masterful work!
Plus huge thanks to Jon Henshaw for the equally adroit “Contents” button popup script.
Words fail.. Perhaps enough said…
Other than acknowledging what we humans manage to do undoubtedly vastly too little, can at most minusculely appreciate how all existence is endless, unimaginably vast gifts of Divine Love, ever sustaining all and everything, every moment to moment.

Similarly: Here’s a site examining fundamental ways living organisms
remain profoundly inexplicable.

As the landmark investigation revealed: An earthquake’s multitude of seismic waves, like a colossal jackhammer repeatedly disturbing if not shocking and disrupting geologic strata where they all contract and converge back together on the opposite side of Earth, make a subsequent earthquake considerably more likely there, soon afterwards (statistically very significantly so).
24Au19


